I thought it would be good to cover off the basics of how you go about performance checking your XQuery code. In this post I’ll cover off common XQuery performance gotchas, and introduce the Profiler that comes free with MarkLogic.
We’re all probably familiar with how to find performance issues in programming languages like Java, or query languages like SQL. Normally each operation we do is pretty atomic and so can be found relatively quickly. XQuery though is both a programming language and a query language. Logic code is often interspersed with XPath, which may in turn contain predicates. This means there’s no clear separation between programming code and query code as far as any profiler is concerned. I thought this was going to be a nightmare, but actually having a single profiler that covers both well is growing on me fast.
Data used in the examples
The example project I’m talking about in this post is around Social Media Analytics. I take public feeds from twitter and facebook every 30 minutes and index them as ‘intercept’ documents. Don’t worry, I’m not doing anything naughty, I just like to call them intercepts as its common terminology used in the Public Sector. Think ‘messages’ or ‘tweets’ or ‘posts’ instead. There are around 39000 of these documents in my database on my laptop (an aging, yet venerable, 2008 MacBook Pro) with the total number of documents in that database sat at around 92000. When I talk about /i:intercept I’m talking about an intercept document at a predefined namespace of i. The value of i isn’t important – it’s just an internal namesapce I use.
Common XQuery problems
First of all it’s important to realise – we could all be better programmers. There are certain ways you structure code when you’re learning that should be un-learnt for writing performant code. There are also certain idiosyncracies to each language, and indeed runtime for that language, that need to be taken in to account. This section covers those off.
Firstly, consider the following code. This basically counts all intercepts sent by a single individual (me!):-
let $domain := "twitter"
let $identity := "@adamfowleruk"
let $senti := /i:intercept[./i:sender/i:identity-ref/i:identity eq $identity
  and ./i:sender/i:identity-ref/i:domain eq $domain ]
let $sentc := fn:count($senti)
return $sentc
This query takes 0.0011 seconds. Pretty darn quick.
Top level document predicate vs. cts:search
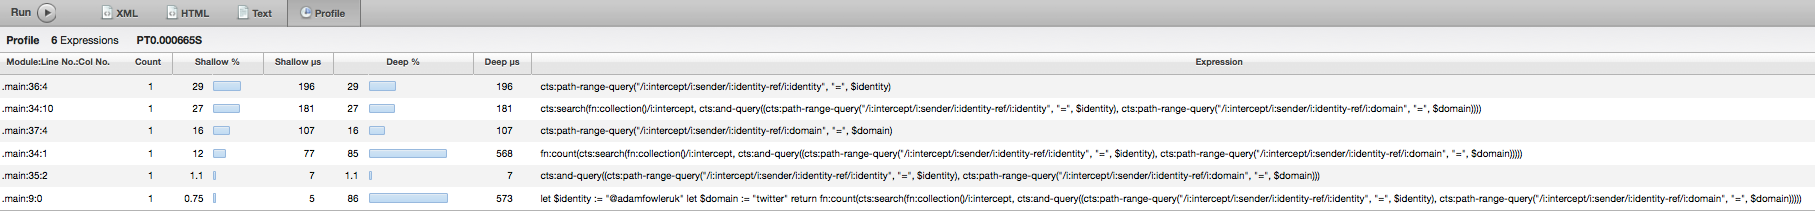
cts:search is MarkLogic’s built in advanced search API. You can refactor the above search in to one that uses cts:search like so:-
 fn:count(cts:search((/i:intercept),
  cts:and-query(
   (cts:path-range-query("/i:intercept/i:sender/i:identity-ref/i:identity","=",$identity),
    cts:path-range-query("/i:intercept/i:sender/i:identity-ref/i:domain","=",$domain)
   )
  )
 ))
This results in query execution time of 0.000665 seconds. Nice and fast. I have the above two paths registered as path range indexes on the server. cts:search uses all available path range indexes as specified in the query. It returns a single result per document that matches all the criteria given. It basically starts at elements and works its way up, whereas XPath starts at the root and works its way down. When you’re starting your query at the document node, this can cost time. Better to use cts:search rather than a predicate on a document node.
Path Range Indexes are a MarkLogic V6 feature. I have the concept of identity-ref/identity in a few places – one under sender, and several under participants (sender + recipients). In version 5 you’d have to use element range indexes which would mix the two up, leaving the predicate some comparison work to filter out spurious results. Now in V6 you can be very specific. You can even use predicates in your XPath for your Path Range Index. Very handy (E.g. to index all twitter sender IDs like @adamfowleruk).
It’s all about the indexes
As you can tell from the cts:search example, indexes help a lot. They also have an effect on predicate speed, at least when not applying predicates at the document level. At one point when I was running a feed every 30 minutes the processing load would crash my laptop! This was entirely down to have no indexes on often used, or needle in the haystack, type of queries in XPath. Before I did any performance tuning it wasn’t unheard of for a single feed update to take over 3 minutes. Bearing in mind I have 11 feeds configured executing straight after one another, and you start to see the magnitude of the problem. Now with indexes I get through the same code in 11 seconds – and 10 of that is HTTP fetching from twitter!
Ingest performance
I’ve used the new mlcp (Content Pump) command a few times. It’s great for loading content. You can even pre-process content. For example, you can split a CSV file in to multiple XML documents, or do the same trick for one large XML document. You can also pass content to several nodes in a cluster. Typically for my purposes I have just one machine, so I tend to throw the thread count up to 10 and the documents per transaction to over 100. This gives me a rate of around 3000 document insertions per second! Doing this without those settings would take a fair old while.
It’s also a good idea if you’re doing a lot of ingesting to set up multiple Forests. For ingestion this is where the work happens, so the more of these you have the more parallel your machine will work. When I need this I tend to go for 3 Forests for a single database server. It all depends on your machine’s available disks and architecture.
Flash memory
MarkLogic server can make use of ‘fast disc’. I.e. if you set up some fast local flash as a disk partition you can instruct MarkLogic to use this for often used data, thus squeezing even more performance out of your system.
QConsole Profiler
The tool shown in the above screen shots is the Query Console, more commonly known as qconsole. It has several output options including Text, XML and Profiler. Executing profiler gives you the output like the above images. This is very handy as it breaks down and orders the XQuery executed by the time taken overall by that method/query as a percentage of total time taken. It breaks performance down to the individual XPath evaluation level. Spending a couple of hours in here should have your system singing away at speed.
Admin Console
The admin console (the thing running on port 8001) has some useful performance features. If you click on a database, then choose the status tab, you see how many ‘hits’ and ‘misses’ your various caches are getting. This gives you a hint as to how well your code is performing generally in the database. On the top right is another handy button – ‘Show Forests’ – which can be useful for a general health check, as well as to see disc usage covering both data and indexes. Indexes can get quite large with MarkLogic, but given the blistering speed you get, and how cheap disc space is these days, this ain’t no bad thing.
